21 October 2013

Waterfront Development: Brooklyn Bridge Park


Similar to the Harbor Point site visit, I visited Battery Park City and Brooklyn Bridge Park on September 27th to study waterfront development. Regina Myer of the Brooklyn Bridge Park Corporation presented some information on Brooklyn Bridge Park that I share below.

History


The original piers were built in the 50s and 60s for bulk cargo. It wasn't until the 80s that they realized the piers were no longer useful and most of them were closed.

Park Details and Design


The park includes a 1.3 mile long esplanade that one can walk along the New York harbor to get views of Staten Island and the Statue of Liberty, the lower Manhattan skyline, the Brooklyn Bridge, The Manhattan Bridge, and much more. There are 6 piers, Fulton Ferry Landing, Empire Fulton Ferry Park, and Main Street Park of DUMBO with free Wi-Fi and charging stations.

Pier 1 is the only one created with landfill. Landscape architecture is different on Pier 1 from other piers because of this. Utilizing salvaged materials from excavation for the Long Island Rail Road, they were able to create a hill 20 ft above the original pier height for better views of the lower Manhattan skyline. There large lawns where they can have gallery and art installations and guests can play or have picnics.


Youngstown Ohio developer donated a historic carousel to the DUMBO pier, Jane’s Carousel.

Pier 5 has three soccer fields utilized by St. Francis, youth and adult weekend leagues, and local schools.

Ted Zoli, a leading highway bridge designer, designed the pedestrian bridge at Pier 1.

The park has had great success. There have been over 1 million visitors to Brooklyn Bridge Park this year to a space that was pretty much off limits about 5 years ago.

Pier 6 has sand volleyball and non-motorized boating (e.g. Canoeing and kayaking).
Etsy, a website catering to the sell of handmade, artsy goods, is headquartered in DUMBO right off the park with an art lab open to the public for art making.

Financing


Parks on the waterfront are more expensive to maintain. Park maintenance is not funded by city, state or federal funds. They raise money through concessions and development sites. The condos near the piers and park pay ground rent and taxes directly to the corporation. The Johns street section was privately owned and has been acquired for park space and a 15 story apartment building.

Empire Stores
Public Art in Brooklyn Bridge Park
Jane's Carousel

Historic Preservation, Resilience, and Sustainability


The Empire Stores building will be preserved and restored.

Brooklyn Bridge Park is inherently resilient. During Super Storm Sandy, loss of plant life was much less than in other areas because they used salt resistant plants, rip rap, and storm water management. Unfortunately, the shoreline still lost electricity for 4 months.

As previously mentioned, fill comes from subway excavation. The park also reused stones from bridge projects and wood for the benches and other décor was reclaimed from original buildings on the piers. They also reused the steel framing from old buildings seen on Pier 6.

Public Art in Hudson River Park
Battery Park City Site Plan
Park View

Compare and Contrast


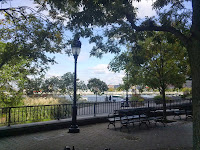
Hudson River Park in Battery Park City has the distinctive old school, regal park design. It utilizes traditional materials like the octagonal pavers. Brooklyn Bridge Park on the other hand uses basic, raw materials like wood and concrete. Hudson River Park feels like Central Park in that the trees act as a barrier to the outside world and you are immersed in the park once you enter. Even with the natural barrier of the expressway, Brooklyn Bridge Park feels more incorporated into its surroundings. It is open and views from every corner of every pier and the esplanade are unobstructed. While you can get lost in nature for a while you never forget that people live just a block away. Both parks offer calmness in the hustle of the City, Brooklyn Bridge Park seems more inviting for the active with volleyball courts and soccer fields. I love the use of public art in both places, but I’m drawn more to Brooklyn Bridge Park. I can see myself spending evening and weekends there with friends. Walking/Jogging on Saturday mornings and looking forward to events held in the park.

What I like about Brooklyn Bridge Park and what I think they do well is programming and public events. Photoville and the DUMBO Arts Festival were welcomed parts of the parks events while we visited. I think Baltimore does a good job of programming events, as well, through the Waterfront Partnership for the Inner Harbor, Harbor East, and Fells Point. Although small, West Shore Park at the Inner Harbor is similar to Brooklyn Bridge Park in that it uses basic materials and it’s very open with unobstructed views of the CBD and the rest of the harbor.  
The “Public”


Even though most of the parks and the esplanade in Battery Park City were there before the buildings, they seem more like an amenity for the adjacent residential buildings. It doesn't feel public. I observed nannies pushing expensive strollers and businessman in suits on lunch. It doesn't seem as inviting for the average New Yorker; they may feel out of place. A certain kind of person can afford to live in the condos and apartments surrounding the parks and I’m not sure if I lived in New York I would go to this park in my spare time.


Waterfront Development: Harbor Point

Source: baltometro.org

On Tuesday, September 10th, I visited the Harbor Point Site just south of Harbor East on Baltimore's harbor. Mike Ricketts, who has 30 years experience in development, educated me on the specifics of the site's development. The following are my notes and reflections from that visit.

I. Project Details


History of Harbor East


It used to be a 70-acre lumber yard with a chromium processing plant that sat on the now Harbor Point site. Chromium preserves wood.

When the plant and lumber yards closed, Baltimore City didn’t want the land broken up into smaller parcels. They wanted an extension of the Inner Harbor for that area. The area vacant at that point was 16 acres. Mayor Schaefer asked a friend/developer to buy the land and hold it to be bought back by the city later. Mayor Schaefer became the governor and needless to say, never bought the land back.

The location and lot size was unique in that it afforded large commercial floor plans, usually seen in the suburbs, with space for parking and even residential opportunities.

The Lancaster building was the first to be built on the Harbor East 16-acre site. It was pre-leased and had 100% occupancy upon opening. It also provided ground floor retail and apartments.

Later the developers proposed a grocery store, Whole Foods, on the ground floor of one the office buildings. The office didn't like the idea of having a grocery retailer in their building, but they were all but won over when Whole Foods was successful with employees and residents alike. Whole Foods benefited greatly for the first 3 years because they were not required to pay rent or operating expenses.

The original 16 acres took about 15 years to develop.

With 1.1 million square feet, the Vue Harbor East building is the largest mixed use project in Baltimore. The Legg Mason building, once completed, will be 1.9 million square feet.

Harbor Point


The 27 acres known as Harbor Point had chromium contamination. Chromium and its byproducts are known to be as harmful as asbestos. The area has a cap that stops the chromium from further contaminating the land and will not be disturbed by the development. The developers will not excavate the land; everything will be built up except the foundation.

The entire site seeks to be an eco-district and environmentally responsible. All buildings in the development area will be LEED Gold or better. The developers will be creating green space and capturing rain water for irrigation. Ten of the 27 acres is dedicated to public open space maintained by the Baltimore Waterfront Partnership. The Exelon building will be the second building on site, Morgan Stanley is the first, and is LEED Gold.

II. Public Access
Apart from the Morgan Stanley building there is nothing currently on the site; it’s basically a parking lot of gravel and rock. For this reason there’s no public access to the water or use of the space. Any addition of public, green space would be an improvement, but I can’t help thinking about how “public” the spaces will be. When we discussed it with Mike he explained that there were already uses that would be prohibited.

The unique thing about Baltimore’s harbor is that there is very little obstruction between the water and people; you can literally walk up and touch it. At Harbor Point this connection will be continued. The development will include a large public park and smaller green spaces between buildings. Central Street will be extended via bridge to the new development, but will not hinder access to the water.

III. Pros and Cons


One of the best aspects of this development is the creation of green, open, public space. This area is a brownfield that hasn’t had as much as a tree in recent history, so adding green space is not only a social opportunity and residential amenity, but also an environmental asset. On the same note, the development seeks to be an eco-district with LEED certified buildings, storm water capture and irrigation systems.

The most unsettling parts of this project are that the site, although capped, is chromium contaminated and that the project is being funded through tax increment financing. Both these things could potentially be detrimental to the site and city respectively. If for some reason the cap doesn’t hold or can support the type of proposed development, the water and ground all around would be contaminated. Moreover, with tax increment financing, if for whatever reason the development doesn’t generate the value projected, the city would have to pay the investors and the city residents would lose out on those tax dollars.

IV. Visual Comparisons


The biggest difference between Harbor East and the Inner Harbor is density. Harbor East has large buildings separated by small streets and although the streets are tree lined there are no green spaces in the development. While there is a waterfront promenade, the buildings seem to block people from the water. Harbor East was made for living. There are hotels and restaurants, but also apartments and condominiums. The development is mixed use.

The Inner Harbor on the other hand, is much more open with direct access to the water. There’s space for large groups to move together on the promenade. It is definitely made for tourists filled with niche and novelty shops, restaurants, and single use buildings. There are only hotels, no residences and the office space is a few blocks away in the central business district. While both areas are walkable, the Inner Harbor feels safer to walk around. You can walk from Pier Six to Rash Field and beyond without crossing a street or coming into contact with vehicular traffic.

Other than the physical design of the buildings in the inner Harbor, I wouldn't change much of anything. Everything services its purpose and people seem to like it. For Harbor East I would incorporate a park and more greenery.

26 September 2013

Green Transportation Hierarchy


Fortunately urban areas have also adopted a green transportation hierarchy. This hierarchy influences prioritizing and funding more efficient modes of transportation.

Green Transportation Hierarchy

1. Pedestrians
2. Bicycles
3. Public Transportation
4. Service and freight vehicles
5. Taxis
6. Multiple occupant vehicles (carpools)
7. Single occupant vehicles

The Parking Revolution

There are 3-4 parking spaces per car in the United States which means 66-75% of spaces will be empty at any given time

Parking lots can be deadly to downtown areas
- people don't have to walk drive or walk thru the city to find parking, businesses are not patronized
Money should not be wasted on infrastructure that is unnecessary

Case Studies

PARK Smart
The neighborhoods are similar, but Park Slope is wealthier and has more cars available, yet Jackson Heights residents are more likely to drive to work in Manhattan


SFpark - parking technology + flexible pricing = better parking
Essentially parking prices can be different on each block and around every corner
Technology to capture data and measure performance

Best Practices

Stop asking how much is enough parking?
Where do minimum parking requirements come from?
Tailor parking requirements
Parking demand varies based on density
Supply and demand
Incorporate maximums ineradicable of minimum
Stop using the requirements that don't make sense for your city
Manage on-street parking
Meters
Do away with time maximums

Remember:

  1. Acknowledge value of curbs
  2. Balance rates and demand
  3. Remove time limits
  4. Keep revenue local
  5. Signage
  6. Street furniture
  7. Street sweeping

*Notes from an APA Conference session

25 September 2013

3rd Annual Urban Farm & Food Fair


I had the opportunity of attending the 3rd Annual Urban Farm & Food Fair on September 21st. The rain held off long enough for me and a friend to enjoy the variety that Baltimore has to offer in its urban food system. I learned so much and was able to get some excellent resources for my masters thesis/professional project. Some of the event exhibitors included: 

Big City Farms
Compost Cab
Farm Alliance Baltimore
Friends & Farms
Future Harvest
Johns Hopkins Center for a Livable Future Aquaponics Project
Real Food Farm
Slow Food Baltimore
University of Maryland Extension's: Growing Healthy Habits
University of Maryland Extension's: Master Gardeners
University of Maryland Institute of Applied Agriculture
Whitelock Community Farm

AND I may or may not be featured in this Baltimore Sun article.


The Brick Industry Association Presents . . .

On September 12th I had the opportunity to attend an event held by The Brick Industry Association for architects and planners. It was held at M&T Bank Stadium and we were able to tour the locker room and go on the field. It was a fun learning experience and it was free (for students)! Below I share notes from the seminar, which included three speakers.


Designing Buildings and Communities for Resiliency


Masonry Resiliency: More Than Building Codes - David Biggs

Resiliency is he ability of a system yo quickly return to equilibrium after disturbance or disaster.

Resilience includes the capacity to anticipate and minimize potential destructive forces through adaptation and resistance.

Sustainable is not equal to resilient.

Characteristics of resilience:
Safety
Durability

Purpose of building codes:
To protect life, health, and safety
Minimum code standards have become defacto to design standard
Not to necessarily provide resiliency

USA Resiliency References:
Government and FEMA Documents
Insurance Industry
Construction Industry

Resilience and Post Disaster Recovery - James Schwab, Manager, APA Hazards Planning Research Center


Suggested reading: "The Resilient City"

1: The Vision of a Resilient Community
Resilience as a concept for governance
Resilience in functional and economic terms
Ability to adapt to social, economic, political, and physical change
Resiliency in the context of natural hazards

Plans for recovery after disasters
Building a local culture of disaster awareness
Providing a focus for per-disaster exercises among designated public officials
Opportunity to establish clear lines of responsibility should the need arise for long term community recovery

2: Disaster Preparedness and Recovery: Expectation and Reality
Components of disaster management
Primer on disaster preparedness
Major federal legislation discussing disaster preparedness

3: Long-term Recovery Planning: Goals and Policies
Whole community recovery (Quality of life in addition to physical rebuilding)
Opportunities for post disaster recovery
   Land use
   Infrastructure
   Housing
   Economic redevelopment

4: Long-term Recovery Planning: Process
Where and when to start
   Before & After
Leadership and collaboration
Broadening public involvement
Psychological and emotional consideration (Grieve)

5: Long :Implementation
Organization and roles
Financing implementation
Estimate milestones and timetables
Implementation as a community enterprise
Legal issues
Measuring success

6: Next Steps in Creating Resilient Communities
Resilience and the future of planning
Fostering public understanding of environmental change
Green communities and economic development
Seizing opportunities and anticipating the unexpected

Case study: Greensburg, KS

The Inherent Sustainability of Brick - Tom Liebel, Mark Thomas Architects


Economy
Brick may be more expensive at the outset but has a life span of 100+ years.

Ecology
It takes a lot of energy and fossil fuels to fire brick, but the industry is becoming more efficiency in that process. Contrarily making brick has much lower impact on water consumption, as opposed to the less expensive vinyl siding which also has great health risks.
Brick tends to be locally sourced lowering the environmental impact of shipping.

Equity
Quality of environment:
Bringing people together to create the sense of community
Bring a sense of history and permanence

Case Study: Millers Court at Howard and 26th Streets, Baltimore

11 May 2013

Leveraging Freight and Transit Assets for Sustainability

Center for Neighborhood Technology (CNT)

Using TOD (Transit Oriented Development) and COD (Cargo Oriented Development)
The Chicago Metro areas freight rail is very active. About 1/3 of all freight movement happens there.
Poorer communities with freight and rail infrastructure can be great places for COD. Supporting intermodal centers and creating jobs.

Transit: TOD Planning and Development Pipeline
Manufacturing companies consider the costs of these 3 things when shooting sites:
Workers Comp
Property Taxes
Distribution

Source
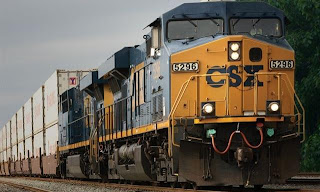
COD in Baltimore: PPP between the state of Maryland and CSX
The Port of Baltimore is both publicly and privately owned. The port predates the founding of the City. It is one of only two ports on the east coast able to accommodate the new Panamax ships. CSX currently occupies a large portion of Seagrit Port. In order to expand the port for he Panamax ships CSX has to be relocated.


Mount Clare Yard is the proposed site for the new CSX intermodal center. It is sandwiched between two residential neighborhoods but below grade. CSX has agreed to switch from diesel forklifts to all electric that will reduce noise and air pollution


Every train must go through Howard Tunnel
$6-10 billion to expand the Howard Tunnel
Built with about 20 million bricks
Does not allow double stacked trains


Source
*Source: 2013 APA National Conference Session

23 April 2013

California: Community Planning for High Speed Rail


The California High Speed Rail project is a system that would serve major cities like Sacramento, San Francisco, San Jose, Los Angeles, Anaheim, San Diego and many cities in between. .Voters approved Proposition 1A to fund the project and construction on a 29-mile segment from Madera to Fresno will begin this July. 

Benefits
Millions of green jobs
Pays or itself
Convenient, comfortable
Congestion relief
Reduces global warming
Reduces oil needs
Lowers cost of military operations

California High Speed Rail 
Phase One: SF to LA
Travel time: 2hrs 40mins
Cost estimate $40 billion (2008)
Cost estimate over $100 billion (2011)
Cost estimate $64 billion (2012) This includes utilizing existing rail lines
Benefits 
Approx 25,000 perm jobs
More property tax
Revitalized downtown 
Summary of the Planning Experience 
1. These are engineering plans, not prepared by planner
2. Get engaged early
3. Uneven benefits
4. Strong community outreach and education
5. Consider community impacts and benefits
6. Capitalize on rail investment for community improvements
7. Collaborate with other cities for effective influence

Additional information can be found here:
California High Speed Rail Authority
California High Speed Rail Blog

Source: APA National Conference Session

Chicago: Connecting Transit to Suburban Employment Centers

Pace Shuttle Bug
Click here for more information
The shuttle bug program provides services in the northeast counties of Illinois. The program is a public private partnership with companies that have job centers in suburban areas. It fills the gap between metro area services and provides a reasonable option for alternative to auto travel.


Metra Commuter Rail
Click here for more information
Operates on Amtrak and freight rail lines and reaches over 60 miles outside Chicago and all routes end in the city center


Things to consider

  • Viable routes/connections to other transit services
  • Commute type-reverse, suburb to suburb, traditional
  • Work schedule


Startup Funding Sources


  • Congestion Mitigation Air Quality (CMAQ)
  • EPA
    • 80% grant requiring 20% local match
    • 2 year term
  • Job Access Reverse Commute (JARC)
  • Competitive grant program under SAFETEA-LU


Cost Allocation to Employers


  • Develop a fair, reasonable cost allocation formula
  • Need to know corporate and public agency budget cycles to plan for funding approvals for new start up and/or annual shuttle service


Retention Criteria


  • Relevance of route
    • Steady growth of ridership
  • Funding Assured
    • Company renews commitment of financial support
  • Performance standards


Service Sustainability


  • Service changes
  • Route/schedule changes
  • Service contractions
    • Transit funding crisis
    • Closed routes


Marketing


  • On site
  • Site specific
    • Incorporate marketing into office fairs or service days (ie health and benefits fairs in for fall enrollment or earth day in spring
  • Introduce bring-a-buddy rider days to introduce potential new riders to transit


Benefits


For riders:

  • Free shuttle because employers pay shuttle assessment
  • Reduces travel costs
For planning:

  • Achieving long range planning goals
Transit agencies:

  • Increases ridership
  • Not just for commuting to work but for other activities and weekend plans
  • Return on investment


Challenges


Employers:

  • Economic conditions
    • Shuttle ridership varies
    • Employers are very cost conscious
    • Employers may cut or add jobs depending on the economy
Agencies:

  • Network issues
    • Constraints in offering earlier morning outbound trains
    • Potential duplication/parallel service
  • Decentralization of jobs
  • Suburban density issues
  • Suburban land use issues
    • Large setbacks
    • Lack or limited pedestrian infrastructure

Source: APA National Conference Session

22 April 2013

Reinventing Neighborhoods with Transportation Investment

Facts show that home values are 40% higher near transit. People want to live near transit for convenience, for property values, and for employment opportunities. More and more people, young and old, want to live in higher densities where they can use multiple modes of transportation as they see fit. 

When it comes to choosing a residence, Millennials (20 & 30 somethings):


  • Prefer walkable neighborhoods
  • Close to transit
  • Accessible to jobs
  • Will trade square footage for these things
  • More bike rides
  • Less miles driven
  • 26% have no drivers license


Case Study - Cleveland RTA (HealthLine, Little Italy-University Center, Euclid Corridor) 

The Silver Line (BRT) is a 5 miles long stretch with 36 stops that links downtown with University Center. Cleveland found success through:
Closing a street to through traffic yet allowing cyclist, pedestrians, and transit
Creating a new multi-modal transit center where one can get:
 * Express buses
 * Shuttles to Park & Rides
 * Train
Multi-modal Stations along the route
Rail-like Service and Image:
 * Dedicated lanes
 * Priority lights
 * Greater speed limits
 * Reduced travel times
Economically diverse communities
 * HUD homes and affordable housing near market price condos


Funding Sources

  • State grants
  • FHWA
  • City (Capital Improvement Program)

Plan for Minimum and Maximums for:

  • Parking time limits
  • Setbacks


Leveraging Resources: Stringing the pearls of finance, politics, and development


Political

  • Buy in/support
  • Engagement
  • Shared vision

Financial

  • Funding for improvements
  • Return
  • TIGER funds

How to be Successful


  • Aggressive land assembly
  • Mixed use development
  • Prioritization of density
  • Bring business to the street
  • More bike facilities
  • Make it a campaign
  • Public-Private Partnerships
  • Don't forget management and maintenance
  • Provide lighting, progressive way finding


For more information visit:
http://www.riderta.com/majorprojects/

Source: APA National Conference Session

Illinois Livable and Sustainable Transportation (I-LAST) Rating System and Guide

Chicago
Source: Google Search

The I-LAST rating system and guide is a sustainability performance metric system developed by the Joint Sustainability Group of the Illinois Department of Transportation (IDOT), the American Council of Engineering Companies–Illinois (ACEC-Illinois) and the Illinois Road and Transportation Builders Association (IRTBA).

I-LAST serves as:


  • Resource Guide
  • Checklist
  • Rating System

It is completely voluntary to utilize the rating system and guide. However, the I-LAST system was created because:


  • There was no organized approach to sustainable design in transportation
  • The current market is too reactive to public demands, as opposed to being proactive
  • Existing sustainable practices often go unrecognized
  • Future sustainability requirements are likely

The purpose of the guide is to:

  • Provide a comprehensive list of practices that have the potential to bring sustainable results to highway projects.
  • Establish a simple and efficient method of evaluating transportation projects with respect to livability, sustainability, and effect on the natural environment.
  • Record and recognize the use of sustainable practices in the transportation industry.

Audiences of the I-LAST System:


  • Engineers
  • Project Managers


Applications of the I-LAST System:


  • Guide to existing practices
  • Source for information
  • Comprehensive approach


Cost implications of using the system:


  • Can be used if finances are very limited
  • There are no extra administrative costs
  • The cost is for results, not documents


Over 150 sustainable items that can be considered in the design of highway projects. The items fall under one of these 8 categories:

1. Planning
2. Design
3. Environmental
4. Water Quality
5. Transportation
6. Lighting
7. Materials
8. Innovation

For more information visit:
www.irtba.org/greencouncil

Source: APA National Conference Session

21 April 2013

Neighborhood-Based Transportation Plans

Jackson Heights
Source: Google Images
Jackson Heights
Source: Google Images
One of the first sessions I attended was a presentation on the New York DOT's approach to neighborhood-based transportation plans in Jackson Heights and Chinatown. The best thing about this case study is that they were able to complete the planning process, from start to finish, in about two years time.

The Approach


The most important aspect of the plan is that the process is guided by the community. The community identifies the issues that they want to see addressed. Short term, non-capital improvements help combat the community perception that planners always do studies and research and nothing ever happens.

Recommendations


  • Avoid technical rigor
  • Utilize scalable techniques
  • Be flexible - if it's not working change it immediately!
    • Ex. No one is at your meeting. Bring the meeting to the people. Go to a neighborhood park, community or senior centers
  • Community meetings
    • Day and evening
    • Provide child care
    • Have meetings in increments
    • Provide translators
    • Provide food 
    • Games make planning issues fun
    • Hold in different locations to get a wide range of perspectives from the same neighborhood
  • Neighborhood walks/tours
    • Engage the whole community
    • Bring out the family

In Jackson Heights and Chinatown


Chinatown
Source: Google Images
Issues

  • No loading area - double parking
  • Bike lane becomes a de facto delivery dock
  • Buses and cars have to maneuver around trucks into oncoming traffic
  • Congested sidewalks so pedestrians are always in the street

Solutions
Chinatown
Source: Google Images

  • Make a street a one way - traffic runs smoother during run hours
  • Wider sidewalks
  • Community validates solutions:
    • Street surveys on the proposed solution for implementation
    • Web portal for post implementation comments and concerns - provides information in real time

Challenges


  • New model - may have to work out kinks/problems
  • Time - spending time nurturing relationships in the neighborhoods
  • Cost

Lessened Learned


  • Give yourself time
  • Remember it's impossible to reach everyone
  • Nurture project and community champions
  • Develop a press strategy
  • Demonstrate how the publics comments were incorporated into the plan
  • The community will participate if they believe input will be taken seriously and they can see tangible changes

For more information visit:
http://a841-tfpweb.nyc.gov/jackson-heights/

Source: APA National Conference Session

Chicago!!!


This past week I had the pleasure (and funds) of attending the American Planning Association National Conference in Chicago, Illinois. I attended many sessions in which I was able to learn so much about implementing transportation plans. I got a chance to explore the city and take in its culture and history. I had a great time chatting with planners, other students, and vendors. Over the next week I'll be sharing what I learned from the sessions at the conference. Happy reading!

17 March 2013

Non-motorized Level-Of-Service Rating Factors


Feature
Definition
Indicators
Network continuity
Whether sidewalks and paths exist, and connect throughout an area.
§  Portion of streets with nonmotorized facilities.
§  Length of path per capita.
§  Network connectivity and density (kilometers of sidewalks and paths per square kilometer).

Network quality
Whether sidewalks and paths are properly designed and maintained.
§  Sidewalk and path functional width.
§  Portion of sidewalks and paths that meet current design standards.
§  Portion of sidewalks and paths in good repair.

Road crossing
Safety and speed of road crossings
§  Road crossing widths.
§  Motor vehicle traffic volumes and speeds.
§  Average pedestrian crossing time.
§  Quantity and quality of crosswalks, signals and crossing guards.

Traffic protection
Separation of nonmotorized traffic from motorized traffic, particularly high traffic volumes and speeds.
§  Distance between traffic lanes and sidewalks or paths.
§  Presence of physical separators, such as trees and bollards.
§  Speed control.

Congestion and user conflicts
Whether sidewalks and paths are crowded or experience other conflicts.
§  Functional width of sidewalk and paths.
§  Peak-period density (people per square meter)
§  Clearance from hazards, such as street furniture and performers within the right-of-way.
§  Number of reported conflicts among users.
§  Facility management to minimize user conflicts.

Topography
Presence of steep inclines.
§  Portion of sidewalks and paths with steep inclines.

Sense of Security
Perceived threats of accidents, assault, theft or abuse.
§  Reported security incidents.
§  Quality of visibility and lighting.

Wayfinding
Guidance for navigating within the station and to nearby destinations.
§  Availability and quality of signs, maps and visitor information services.

Weather protection
User protected from sun and rain.
§  Presence of shade trees and awnings.

Cleanliness
Cleanliness of facilities and nearby areas.
§  Litter, particularly potentially dangerous objects.
§  Graffiti on facilities and nearby areas.
§  Effectiveness of sidewalk and path cleaning programs.

Attractiveness
The attractiveness of the facility, nearby areas and destinations.
§  Quality of facility design.
§  Quality of nearby buildings and landscaping.
§  Area Livability (environmental and social quality of an area).
§  Community cohesion (quantity and quality of positive interactions among people in an area).
§  Number of parks and recreational areas accessible by nonmotorized facilities.

Marketing
Effectiveness of efforts to encourage nonmotorized transportation.
§  Quality of nonmotorized education and promotion programs.
§  Nonmotorized transport included in Commute Trip Reduction programs.


Source: Introduction to Multi-Modal Transportation Planning, Victoria Transport Policy Institute. 2012